Sobre
A idéia principal aqui é coletar dados ECG com a intenção de tentar prever crises epiléticas. Mais sobre o projeto em Dispositivo para prever crises epiléticas.
O estudo está “on going”, vou atualizando essa nota com updates.
Por agora, apenas testes com a controladora e sensor. A próxima etapa é saber como lidar com os dados. Já vi uma possibilidade usando talvez neurokit.
Depois, possivelmente podemos usar um MQTT para receber os dados do dispositivo e processa-los. Nesse ponto, parece ser possível usar técnicas descritas nesses artigos:
- An approach to detect and predict epileptic seizures with high accuracy using CNN and single-lead-ECG signal.
- Wearable Epileptic Seizure Prediction System with Machine-Learning-Based Anomaly Detection of Heart Rate Variability
- ECG-Based Semi-Supervised Anomaly Detection for Early Detection and Monitoring of Epileptic Seizures
Implementação
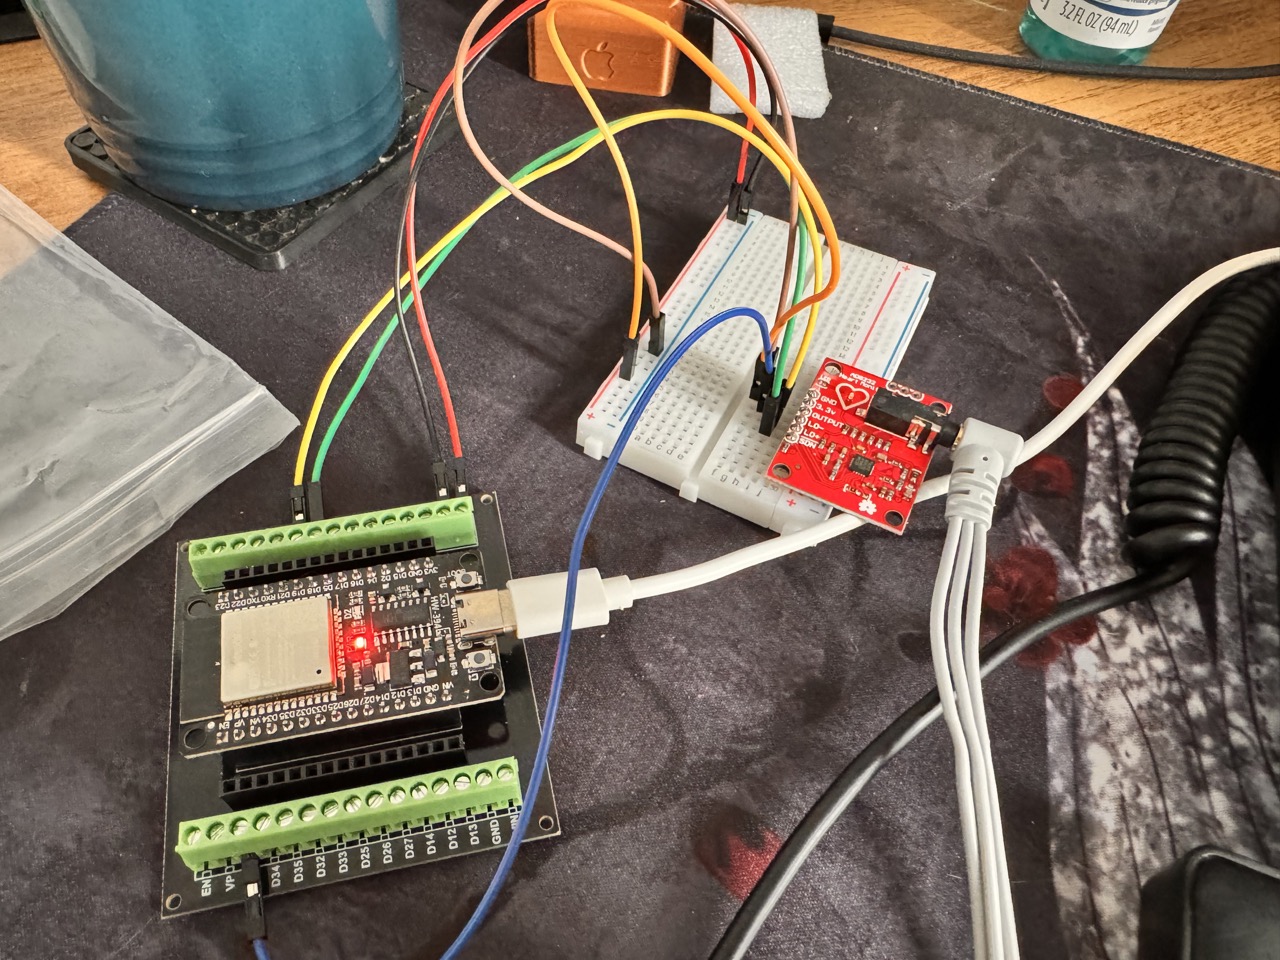
Usei uma ESP32 como controladora e Placa AD8232 para coleta do sinal analógico dos Eletrodos.
Exemplo de código com ESP32
Fonte: 1 (com adaptação do código arduino para ESP32 pelo modelo OpenAI O1)
Minha conexão dos pinos entre as placas:
Lo- (amarelo): D19 Lo+ (verde): D18 Output (analog): 39 - Usando GPIO39 (Porta VN na ESP32)
/*
 * ECG Data Collection using the AD8232 module with ESP32.
 * This code collects the ECG signal and applies a digital notch filter to eliminate
 * 60Hz power line noise.
 * The built-in LED lights up when the AD8232 module detects a loose electrode.
 *
 * Notch filter based on:
 *   CHOY, T. T. C.; LEUNG, P. M. Real-time microprocessor-based
 *   50 Hz notch filter for ECG. Journal of Biomedical Engineering,
 *   v. 10, n. 3, p. 285-288, 1988.
 *
 * Filter options vary with the sampling frequency (Fs):
 *  For Fs = 120Hz, use "N_POINTS 2" and "N 1"
 *  For Fs = 240Hz, use "N_POINTS 3" and "N 2"
 *  For Fs = 360Hz, use "N_POINTS 4" and "N 3"
 *  "a" should be between 0 and 1:
 *    - "a" close to 0 distorts the ECG signal more but is less susceptible to variations
 *      in noise and sampling frequencies.
 *    - "a" close to 1 distorts the ECG signal less but is more susceptible to variations
 *      in noise and sampling frequencies.
 *
 * Created by: Erick Dario León Bueno de Camargo, 2023
 * Adapted by: [Your Name], 2023
 */

// Desired sampling frequency in Hz:
#define SAMPLE_FREQUENCY 120

// Constants for the notch filter
#define N_POINTS 2
#define N 1
#define a 0.05

// Pin definitions based on your hardware setup
#define ANALOG_PIN 39      // Use GPIO39 (Port VN in) (ADC1_CH0) for analog input
#define LO_MINUS_PIN 19    // GPIO19 for "Lo-"
#define LO_PLUS_PIN 18     // GPIO18 for "Lo+"
#define LED_PIN 2          // Built-in LED (adjust if necessary)

unsigned long sample_interval_us = 1000000UL / SAMPLE_FREQUENCY;
int X[N_POINTS];   // Array for current measurements
int Y[N_POINTS];   // Array for filtered measurements
unsigned long current_time, previous_time;
int counter = 0;

void setup() {
  Serial.begin(115200);
  pinMode(LO_MINUS_PIN, INPUT);
  pinMode(LO_PLUS_PIN, INPUT);
  pinMode(LED_PIN, OUTPUT);
  previous_time = micros();
}

void loop() {
  current_time = micros();

  // Check for loose electrodes
  if ((digitalRead(LO_MINUS_PIN) == HIGH) || (digitalRead(LO_PLUS_PIN) == HIGH)) {
    digitalWrite(LED_PIN, HIGH);
  } else {
    digitalWrite(LED_PIN, LOW);

    // Sampling at precise intervals
    if (current_time - previous_time >= sample_interval_us) {
      previous_time += sample_interval_us;  // Maintain consistent sampling rate

      // Read analog value from the ECG module
      X[counter] = analogRead(ANALOG_PIN);

      int previous_index = (counter + N_POINTS - N) % N_POINTS;

      // Apply notch filter
      Y[counter] = ((X[counter] + X[previous_index]) / 2) +
                   a * (((X[counter] + X[previous_index]) / 2) - Y[previous_index]);

      // Output the filtered signal
      Serial.println(Y[counter]);

      // Update counter
      counter = (counter + 1) % N_POINTS;
    }
  }
}
Exemplo de dados coletados
Python para coleta dos dados da porta serial usando a lib pyserial.
import serial
import time

# Adjust the serial port and baud rate to match your setup
# ser = serial.Serial('COM3', 115200)  # For Windows, e.g., 'COM3'
# ser = serial.Serial('/dev/ttyUSB0', 115200)  # For Linux
ser = serial.Serial('/dev/tty.usbserial-112220', 115200)  # For macOS


# Create or open a file to write the data
with open('./ecg_data.csv', 'w') as file:
    # Write header if needed
    file.write('timestamp,data\n')

    # Collect data for a specified duration or until stopped
    try:
        while True:
            # Read a line from the serial port
            line = ser.readline().decode('utf-8').strip()
            # Get the current timestamp
            timestamp = time.time()
            # Write timestamp and data to the file
            file.write(f'{timestamp},{line}\n')
            # Print to the console for monitoring (optional)
            print(f'{timestamp},{line}')
    except KeyboardInterrupt:
        print("Data collection stopped by user.")

# Close the serial port
ser.close()
Sample rate de 120hz Dados: ecg_data_120.csv
Sample rate de 360hz Dados: ecg_data_360.csv
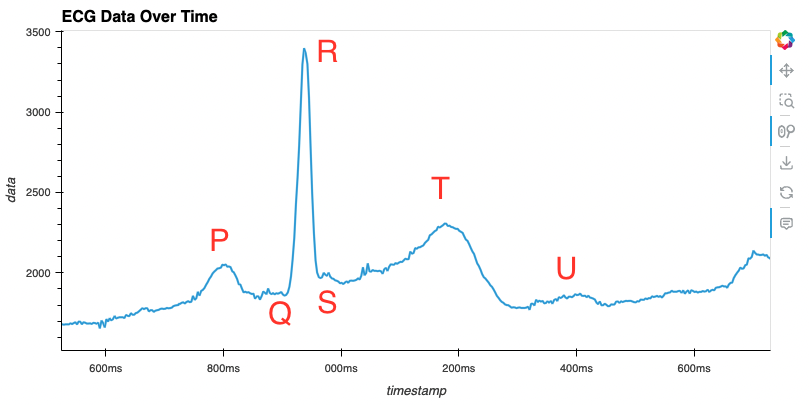
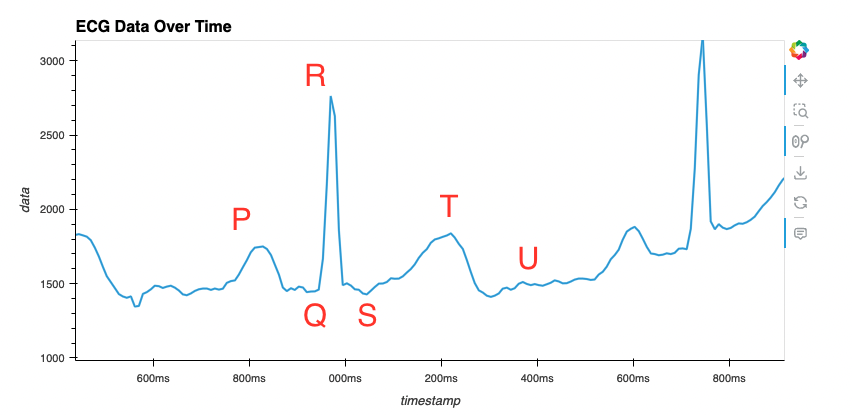
Código pandas com hvplot usado para “plotar” os dados:
import pandas as pd
import hvplot.pandas  # hvPlot extension

# Load the ECG data
file_path = 'ecg_data.csv'
ecg_data = pd.read_csv(file_path)

# Convert the timestamp to a more readable format if necessary
# Assuming timestamp is in seconds, convert it to datetime
ecg_data['timestamp'] = pd.to_datetime(ecg_data['timestamp'], unit='s')

# Convert 'data' to numeric, forcing errors to NaN (e.g., "S1774" is invalid)
ecg_data['data'] = pd.to_numeric(ecg_data['data'], errors='coerce')

# Create an interactive plot using hvPlot
ecg_data.hvplot(x='timestamp', y='data', title='ECG Data Over Time', width=800, height=400)
Interpretação do ECG
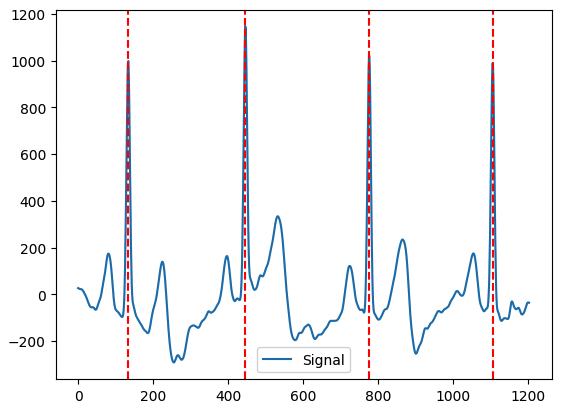
Usando a lib neurokit
import neurokit2 as nk

values = ecg_data['data'].values

cleaned_ecg = nk.ecg_clean(values, sampling_rate=360) # 360hz

_, rpeaks = nk.ecg_peaks(cleaned_ecg, sampling_rate=360)

plot = nk.events_plot(rpeaks['ECG_R_Peaks'], cleaned_ecg)
Output: